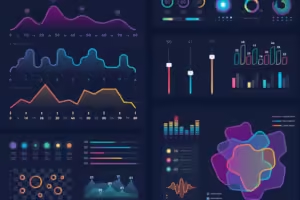
In 2024, the landscape of business analytics is experiencing a significant transformation, driven by the rise of interactive data visualizations. These innovative tools are reshaping how businesses interpret data, make decisions, and drive growth. This article explores the revolutionary impact of interactive data visualizations on business analytics, highlighting their benefits, applications, and future trends.
The Evolution of Data Visualization
Traditionally, data visualization involved static charts and graphs that offered a limited perspective on business data. However, as data volumes and complexity have increased, businesses have sought more dynamic ways to understand and analyze their information. Interactive data visualizations have emerged as a solution, enabling users to engage with data in a more meaningful way.
Interactive visualizations allow users to manipulate and explore data through features like zooming, filtering, and real-time updates. This interactivity empowers users to uncover insights that static charts might miss, leading to more informed decision-making.
Benefits of Interactive Data Visualizations
- Enhanced Data Exploration: Interactive visualizations enable users to drill down into data, uncovering hidden patterns and trends. For example, a sales dashboard might allow users to filter data by region, product line, or time period, providing a more granular view of performance metrics.
- Improved Decision-Making: By offering real-time insights and the ability to test different scenarios, interactive visualizations support better decision-making. Business leaders can use these tools to model potential outcomes and assess the impact of various strategies before implementation.
- Increased Engagement: Interactive visualizations make data more accessible and engaging for users. Instead of passively reviewing static reports, users can actively explore data, which enhances understanding and retention.
- Real-Time Data Analysis: With interactive visualizations, businesses can analyze data in real time, allowing for quicker responses to changing conditions. For instance, real-time dashboards can monitor key performance indicators (KPIs) and alert users to anomalies as they occur.
- Customization and Flexibility: Interactive tools offer customization options that cater to specific user needs and preferences. Businesses can tailor visualizations to highlight the most relevant data, making it easier for users to focus on what matters most.
Applications of Interactive Data Visualizations
- Financial Analysis: Interactive dashboards in financial analysis provide a comprehensive view of financial performance. Users can explore revenue trends, expense breakdowns, and profitability ratios with customizable filters and drill-down options.
- Marketing Insights: Marketers use interactive visualizations to analyze campaign performance, customer behavior, and market trends. By interacting with visual data, they can identify successful strategies and optimize future campaigns.
- Operations Management: In operations management, interactive visualizations help monitor supply chain performance, track inventory levels, and assess production efficiency. Real-time data enables managers to address issues promptly and streamline operations.
- Customer Analytics: Interactive tools allow businesses to gain deeper insights into customer preferences and behaviors. By visualizing customer data interactively, companies can identify trends, segment audiences, and personalize marketing efforts.
- Human Resources: HR departments use interactive visualizations to analyze employee data, track performance metrics, and manage workforce planning. Interactive dashboards provide insights into employee engagement, turnover rates, and other critical HR metrics.
Future Trends in Interactive Data Visualization
- Artificial Intelligence Integration: The integration of AI with interactive data visualizations is expected to enhance predictive analytics and automation. AI-powered tools can offer advanced data insights and automated recommendations based on interactive analysis.
- Augmented Reality (AR) and Virtual Reality (VR): AR and VR technologies are set to transform data visualization by providing immersive and interactive experiences. Users can interact with data in three-dimensional space, offering a new dimension of analysis.
- Increased Personalization: Future interactive visualizations will offer even more personalized experiences, adapting to individual user preferences and behaviors. This level of customization will further enhance the relevance and usefulness of data insights.
- Enhanced Collaboration Features: Collaborative features in interactive visualizations will allow teams to work together more effectively. Shared dashboards, real-time annotations, and collaborative data exploration will facilitate teamwork and decision-making.
- Advanced Data Integration: As businesses adopt more diverse data sources, interactive visualizations will increasingly integrate with various data platforms and applications. This will enable seamless data consolidation and comprehensive analysis.
Conclusion
Interactive data visualizations are revolutionizing business analytics in 2024 by providing dynamic, engaging, and insightful tools for data exploration and decision-making. Their ability to enhance data exploration, improve decision-making, and offer real-time analysis makes them indispensable in today’s data-driven business environment. As technology continues to evolve, interactive visualizations will play an increasingly vital role in helping businesses navigate the complexities of modern data landscapes.


