
In the world of data analysis, statistical significance is a critical concept that helps researchers, analysts, and decision-makers determine whether the results of their studies or experiments are likely to be genuine or if they could have occurred by chance. As we move through 2024, understanding statistical significance has become even more vital due to the increasing complexity of data and the growing reliance on data-driven decisions. This article explores what statistical significance means, why it matters, and how it impacts your data analysis in the current year.
What is Statistical Significance?
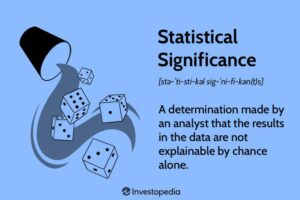
Statistical significance is a measure that helps you determine whether the results of your study or experiment are likely to be true and not just due to random chance. It is often expressed as a p-value, which quantifies the probability of obtaining the observed results, or more extreme results, if the null hypothesis is true.
- Null Hypothesis (H0): The null hypothesis is a statement that there is no effect or no difference between groups. It serves as a starting point for statistical testing.
- Alternative Hypothesis (H1): The alternative hypothesis suggests that there is an effect or a difference.
A result is considered statistically significant if the p-value is less than a predetermined threshold, commonly 0.05. This threshold means there is a less than 5% probability that the observed results occurred by chance.
Why Statistical Significance Matters
Understanding statistical significance is crucial for several reasons:
- Decision-Making: In data-driven decision-making, it is essential to ensure that the findings are reliable and not just random fluctuations. Statistical significance provides a level of confidence in the results.
- Research Validity: For researchers, demonstrating statistical significance helps validate the findings and contributes to the body of knowledge. It ensures that the results are not merely coincidental.
- Resource Allocation: In business and industry, significant results can justify the allocation of resources, such as funding or manpower, to projects or initiatives.
- Policy Making: Policymakers rely on statistically significant findings to shape and implement policies that affect the public. Ensuring these results are robust is essential for effective governance.
How Statistical Significance Impacts Data Analysis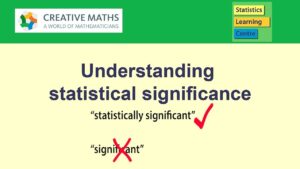
In 2024, the impact of statistical significance on data analysis is more pronounced due to the following factors:
- Increased Data Complexity: With the advent of big data and advanced analytics tools, data sets have become larger and more complex. Statistical significance helps in making sense of this complexity by providing a framework for evaluating the validity of findings.
- Advanced Statistical Methods: New statistical methods and models have emerged that offer more sophisticated ways to assess significance. Techniques like Bayesian statistics and machine learning algorithms are increasingly used to complement traditional significance testing.
- Big Data and Significance Testing: In the era of big data, even small p-values can be obtained due to the sheer volume of data. It’s crucial to interpret these results carefully to avoid overestimating the importance of findings.
- Ethical Considerations: There is growing awareness about the ethical implications of statistical significance. Researchers are encouraged to report results transparently and avoid practices like p-hacking, where data is manipulated to achieve a desired p-value.
Interpreting Statistical Significance in Practice
Understanding and interpreting statistical significance requires careful consideration:
- Effect Size: While statistical significance tells you if an effect exists, it does not measure the size of the effect. Effect size provides context and helps assess the practical significance of the results.
- Confidence Intervals: Confidence intervals offer a range within which the true effect is likely to fall. They provide additional information beyond the p-value and are essential for understanding the precision of the estimate.
- Replication: Replicating studies and experiments helps confirm the validity of findings. A result that is statistically significant in one study should be tested in other contexts to ensure its robustness.
Common Misconceptions About Statistical Significance
Several misconceptions about statistical significance can lead to misinterpretations:
- Significance Equals Importance: A statistically significant result does not necessarily mean that the findings are practically important or meaningful.
- P-Value Thresholds are Absolute: The commonly used threshold of 0.05 is not a strict rule. Depending on the context, different thresholds may be appropriate.
- Significance Implies Causation: Statistical significance does not imply causation. It only indicates an association between variables, which needs further investigation to establish causal relationships.
Best Practices for Reporting Statistical Significance
To ensure clarity and integrity in reporting statistical significance:
- Report P-Values and Effect Sizes: Provide both p-values and effect sizes to give a complete picture of the results.
- Use Confidence Intervals: Include confidence intervals to offer a range for the estimated effects.
- Be Transparent: Clearly describe the methods and criteria used for significance testing and any limitations of the study.
- Avoid Overreliance on Significance: Consider statistical significance as part of a broader analysis that includes practical significance, context, and theoretical implications.
Conclusion
As we navigate through 2024, the concept of statistical significance remains a cornerstone of data analysis. Understanding its role and impact helps ensure that findings are reliable, meaningful, and useful for decision-making. By applying best practices and avoiding common pitfalls, analysts and researchers can make informed conclusions that drive progress and innovation in their respective fields.

