In the dynamic world of finance, making informed investment decisions requires more than just a hunch. Investors rely on financial ratios to evaluate a company’s performance, compare it to peers, and assess its viability as an investment. This article will delve into the essential financial ratios every investor should understand and utilize to unlock the power of their investment strategies.
Understanding Financial Ratios
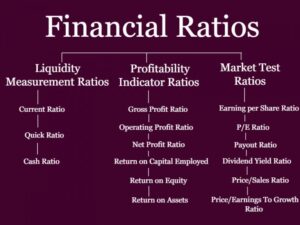
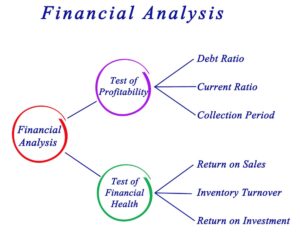
Financial ratios are mathematical comparisons of financial statement accounts or categories. They provide insights into various aspects of a company’s operations, efficiency, profitability, and financial health. These ratios are crucial for investors as they simplify complex financial statements, making it easier to compare companies across industries and over time.
Key Types of Financial Ratios
- Liquidity Ratios
Liquidity ratios measure a company’s ability to meet its short-term obligations. The most common liquidity ratios include:
- Current Ratio: This ratio is calculated by dividing current assets by current liabilities. It indicates whether the company has enough assets to cover its short-term liabilities.
Current Ratio=Current AssetsCurrent Liabilities\text{Current Ratio} = \frac{\text{Current Assets}}{\text{Current Liabilities}}Current Ratio=Current LiabilitiesCurrent Assets
- Quick Ratio (Acid-Test Ratio): This ratio excludes inventory from current assets, providing a more stringent measure of liquidity.
Quick Ratio=Current Assets−InventoryCurrent Liabilities\text{Quick Ratio} = \frac{\text{Current Assets} – \text{Inventory}}{\text{Current Liabilities}}Quick Ratio=Current LiabilitiesCurrent Assets−Inventory
- Current Ratio: This ratio is calculated by dividing current assets by current liabilities. It indicates whether the company has enough assets to cover its short-term liabilities.
- Profitability Ratios
Profitability ratios assess a company’s ability to generate earnings relative to its revenue, assets, equity, and other financial metrics. Key profitability ratios include:
- Gross Profit Margin: This ratio indicates the percentage of revenue that exceeds the cost of goods sold (COGS).
Gross Profit Margin=Revenue−COGSRevenue×100\text{Gross Profit Margin} = \frac{\text{Revenue} – \text{COGS}}{\text{Revenue}} \times 100Gross Profit Margin=RevenueRevenue−COGS×100
- Net Profit Margin: This ratio shows the percentage of revenue that remains as profit after all expenses are deducted.
Net Profit Margin=Net IncomeRevenue×100\text{Net Profit Margin} = \frac{\text{Net Income}}{\text{Revenue}} \times 100Net Profit Margin=RevenueNet Income×100
- Return on Assets (ROA): ROA measures how efficiently a company uses its assets to generate profit.
ROA=Net IncomeTotal Assets×100\text{ROA} = \frac{\text{Net Income}}{\text{Total Assets}} \times 100ROA=Total AssetsNet Income×100
- Return on Equity (ROE): This ratio indicates the return generated on shareholders’ equity.
ROE=Net IncomeShareholders’ Equity×100\text{ROE} = \frac{\text{Net Income}}{\text{Shareholders’ Equity}} \times 100ROE=Shareholders’ EquityNet Income×100
- Gross Profit Margin: This ratio indicates the percentage of revenue that exceeds the cost of goods sold (COGS).
- Leverage Ratios

Leverage ratios evaluate the degree to which a company utilizes debt to finance its operations. Key leverage ratios include:
- Debt-to-Equity Ratio: This ratio compares a company’s total debt to its shareholders’ equity.
Debt-to-Equity Ratio=Total DebtShareholders’ Equity\text{Debt-to-Equity Ratio} = \frac{\text{Total Debt}}{\text{Shareholders’ Equity}}Debt-to-Equity Ratio=Shareholders’ EquityTotal Debt
- Interest Coverage Ratio: This ratio measures a company’s ability to pay interest on its debt.
Interest Coverage Ratio=EBITInterest Expense\text{Interest Coverage Ratio} = \frac{\text{EBIT}}{\text{Interest Expense}}Interest Coverage Ratio=Interest ExpenseEBITwhere EBIT is Earnings Before Interest and Taxes.
- Debt-to-Equity Ratio: This ratio compares a company’s total debt to its shareholders’ equity.
- Efficiency Ratios
Efficiency ratios, also known as activity ratios, assess how effectively a company uses its assets and liabilities. Key efficiency ratios include:
- Inventory Turnover: This ratio shows how many times a company’s inventory is sold and replaced over a period.
Inventory Turnover=COGSAverage Inventory\text{Inventory Turnover} = \frac{\text{COGS}}{\text{Average Inventory}}Inventory Turnover=Average InventoryCOGS
- Receivables Turnover: This ratio measures how efficiently a company collects revenue from its customers.
Receivables Turnover=Net Credit SalesAverage Accounts Receivable\text{Receivables Turnover} = \frac{\text{Net Credit Sales}}{\text{Average Accounts Receivable}}Receivables Turnover=Average Accounts ReceivableNet Credit Sales
- Inventory Turnover: This ratio shows how many times a company’s inventory is sold and replaced over a period.
Importance of Financial Ratios in Investment Decisions
Financial ratios are indispensable tools for investors. Here’s why:
Simplifying Comparisons
Financial ratios standardize data, making it easier to compare companies of different sizes or within different industries. This comparative analysis helps investors identify the best-performing companies and potential investment opportunities.
Assessing Financial Health
By analyzing liquidity, profitability, leverage, and efficiency ratios, investors can gauge a company’s overall financial health. This assessment helps in understanding whether a company is financially stable, over-leveraged, or struggling with profitability.
Identifying Trends
Financial ratios over multiple periods can reveal trends in a company’s performance. Investors can identify whether a company’s financial health is improving or deteriorating, aiding in making timely investment decisions.
Risk Management
Understanding a company’s leverage ratios helps investors assess the risk associated with debt. High leverage might indicate potential financial distress, while strong profitability ratios suggest robust earning potential, helping investors balance risk and return.
Valuation Insights
Ratios such as the Price-to-Earnings (P/E) ratio provide insights into how the market values a company relative to its earnings. This valuation metric is crucial for investors to determine whether a stock is overvalued, undervalued, or fairly priced.
Conclusion
Unlocking the power of financial ratios is essential for investment success. By mastering liquidity, profitability, leverage, and efficiency ratios, investors can make informed decisions, manage risks, and identify promising opportunities. These ratios are not just numbers; they tell a story about a company’s financial health, performance, and potential. Armed with this knowledge, investors can navigate the complexities of the financial markets with confidence and precision.


