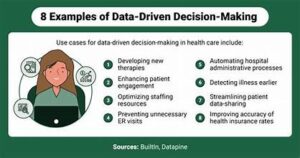
In the era of big data and advanced analytics, inferential statistics plays a crucial role in making informed decisions based on data. As we advance into 2024, mastering inferential statistics is more essential than ever for professionals across various fields, from business to healthcare. This article explores key techniques and applications of inferential statistics that are shaping data-driven decision-making today.
What is Inferential Statistics?
Inferential statistics involves making predictions or inferences about a population based on a sample of data. Unlike descriptive statistics, which focuses on summarizing and describing data, inferential statistics aims to draw conclusions and make decisions based on sample data. This branch of statistics helps in understanding trends, making predictions, and testing hypotheses.
Key Techniques in Inferential Statistics
- Hypothesis Testing
Hypothesis testing is a fundamental technique in inferential statistics used to determine whether there is enough evidence to reject a null hypothesis. The null hypothesis (H0) typically represents a default position or no effect, while the alternative hypothesis (H1) suggests that there is an effect or difference.
- Steps in Hypothesis Testing:
- Formulate the null and alternative hypotheses.
- Choose a significance level (alpha), commonly 0.05.
- Collect and analyze data.
- Calculate the test statistic and p-value.
- Compare the p-value to the significance level to decide whether to reject the null hypothesis.
For instance, in clinical trials, hypothesis testing helps determine whether a new drug is more effective than an existing treatment.
- Steps in Hypothesis Testing:
- Confidence Intervals
Confidence intervals (CIs) provide a range of values within which the true population parameter is expected to fall. A 95% confidence interval implies that if the same experiment were conducted multiple times, the true parameter would fall within the interval 95% of the time.
- Construction of Confidence Intervals:
- Determine the sample mean and standard deviation.
- Use the appropriate distribution (e.g., normal or t-distribution) based on sample size and data characteristics.
- Calculate the margin of error and construct the interval.
Confidence intervals are widely used in survey results to estimate the precision of the findings.
- Construction of Confidence Intervals:
- Regression Analysis
Regression analysis examines the relationship between a dependent variable and one or more independent variables. It helps in understanding how changes in independent variables impact the dependent variable.
- Types of Regression Analysis:
- Linear Regression: Assumes a linear relationship between variables. Used for predicting outcomes and identifying trends.
- Multiple Regression: Involves multiple predictors to understand their combined effect on the dependent variable.
- Logistic Regression: Used for binary outcome variables to estimate probabilities.
For example, businesses use regression analysis to predict sales based on advertising spend, market trends, and other factors.
- Types of Regression Analysis:
- Analysis of Variance (ANOVA)
ANOVA is used to compare the means of three or more groups to determine if there are statistically significant differences between them. It helps in understanding if any factor significantly affects the outcome variable.
- Types of ANOVA:
- One-Way ANOVA: Tests the effect of a single factor.
- Two-Way ANOVA: Examines the effects of two factors simultaneously.
ANOVA is commonly used in experimental research to test the impact of different treatments or conditions.
- Types of ANOVA:
- Chi-Square Test
The Chi-Square test assesses the association between categorical variables. It helps determine whether there is a significant relationship between two categorical variables or if the observed frequencies differ from expected frequencies.
- Applications of Chi-Square Test:
- Chi-Square Test for Independence: Evaluates the relationship between two categorical variables.
- Chi-Square Goodness of Fit Test: Tests if a sample data matches a population with a specific distribution.
This test is frequently used in market research to analyze consumer preferences and behaviors.
- Applications of Chi-Square Test:
Applications of Inferential Statistics in 2024
- Business Analytics
In the business world, inferential statistics guide strategic decisions and operational improvements. Techniques such as regression analysis and hypothesis testing are used to forecast sales, evaluate marketing campaigns, and optimize resource allocation.
- Healthcare and Medicine
Healthcare professionals rely on inferential statistics to analyze clinical trials, evaluate treatment efficacy, and make evidence-based decisions. Confidence intervals and hypothesis testing help in assessing the effectiveness of new treatments and interventions.
- Social Sciences
Social scientists use inferential statistics to study and understand human behavior, societal trends, and demographic patterns. Techniques like ANOVA and regression analysis help in analyzing survey data and conducting experimental research.
- Finance and Economics
In finance and economics, inferential statistics is essential for risk assessment, investment analysis, and economic forecasting. Regression models and hypothesis testing are used to predict market trends and evaluate financial strategies.
- Technology and Data Science
With the rise of big data and artificial intelligence, inferential statistics is crucial for data analysis and machine learning. Techniques such as regression analysis and hypothesis testing are used to build predictive models and optimize algorithms.
Challenges and Considerations
While inferential statistics offers powerful tools for data analysis, it also presents challenges. Ensuring data quality, selecting appropriate models, and interpreting results correctly are essential for making accurate and reliable conclusions. Additionally, understanding the limitations of statistical methods and avoiding overfitting are crucial for valid results.
Conclusion
Mastering inferential statistics in 2024 is vital for anyone involved in data-driven decision-making. From hypothesis testing to regression analysis, these techniques provide valuable insights and support informed decisions across various domains. By understanding and applying these key methods, professionals can leverage data to drive success and achieve their goals.
As we continue to advance in the field of statistics, staying updated with the latest techniques and applications will be essential for making the most of the data at our disposal. Whether you’re in business, healthcare, social sciences, finance, or technology, mastering inferential statistics will enhance your ability to make data-driven decisions and stay ahead in a rapidly evolving world.


